|
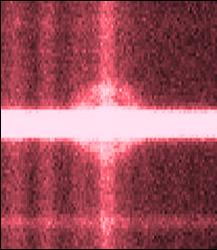
The spatially resolved structure near the hydrogen emission Hα
line was found in the spectrum taken with the BTA/SCORPIO in June, 2013.
It extendeds by 6.5 arcsec along the frame vertical, and by 2600 km/s
(radial velocity) along the centre line of the frame. The structure has
been formed by an empty spherical shell that has erupted during the
outburst 13.5 years ago, and is now expanding with the velocity of
1300 km/s. The expansion velocity of 0.24 arcsec/yr corresponds to
the distance to the nova of 1.2±0.2 kpc.
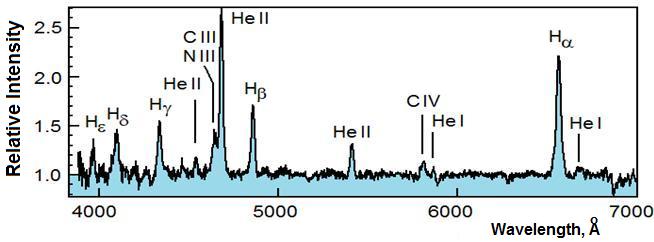
The fragment of the Nova V1494 Aql spectrum is shown in Fig.1.
The spectrum is characteristic of cataclysmic variable stars.
The He II 4686 Å emission line is the strongest in the spectrum.
Other He II lines at the wavelengths of 4200, 4542 and 5412 Å
are also visible. The Balmer emission line series is represented well
and visible up to Hζ in the short-wavelength region (Fig.2).
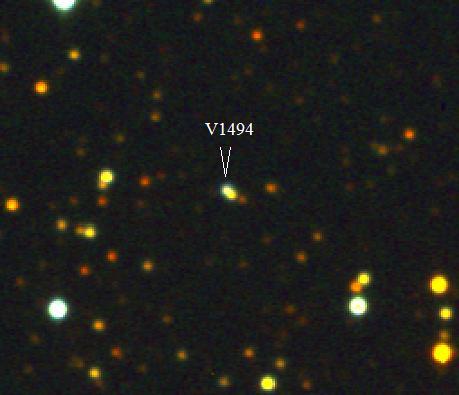
Photometric observations of this nova were performed with the Zeiss-1000
telescope of the SAO RAS and with the 60-cm telescope of the SAI Crimean
Station. The stellar field around this nova is presented in Fig.3.
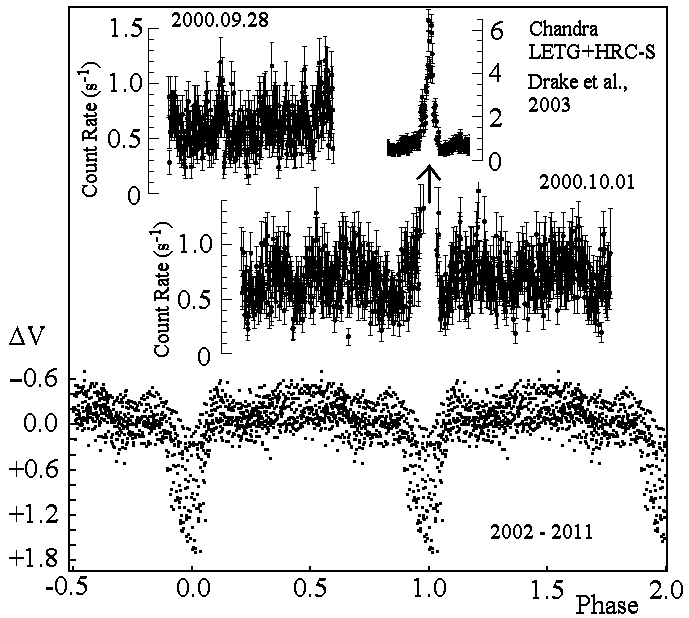
V1494 Aql is an eclipsing system. The analysis of 22 mid-eclipse time
moments revealed an accurate orbital period in the system to be 3 hours,
13 minutes, and 50.8310 seconds, the eclipse duration of about 40 minutes,
and the eclipse depth of 2 magnitudes (Fig.4).
The Nova V1494 Aql has passed the stage of the supersoft X-ray source
(SSS) in the period between 218 and 516 days after the visible light
maximum (Schwarz et al., ApJ V.197, p. 31, 2011). It is considered that
the source of radiation in the soft X-rays is thermonuclear burning of
hydrogen on the surface of the white dwarf. The X-ray radiation is usually
recorded after the shell erupted by nova becomes rarefied and transparent
to the X-rays. It is surprising that given such deep eclipses in the
visible light, the soft X-rays did not reveal any traces of the eclipse,
based on the data of the Chandra space telescope (Fig.4). This is
possible in the case if the source of X-ray radiation is not directly
visible, when only the radiation scattered by the shell located at a
big distance from the source can be recorded.
Published:
E.A.Barsukova, A.F.Valeev (SAO RAS), V.P.Goranskij and A.V.Zharova
(SAI, Moscow University),
ATel No.5454 (2013)
Contact - E.A.Barsukova
Fig.2.
The spectrum of Nova V1494 Aql taken on 2013 June 9 with BTA/SCORPIO
Fig.4.
The light curve of V1494 Aql plotted versus the phase is at the bottom.
The soft X-ray range observations are taken with the Chandra space
telescope, and are plotted on the graph versus the phase of the same
orbital elements. According to the graph, a large X-ray outburst,
indicated with a vertical arrow, has happened just in the time of the eclipse
|
Fig.1.
A fragment of Nova V1494 Aql spectrum taken at the BTA coupled
with the SCORPIO focal reducer in the long-slit mode. The ring
structure in the center of the image is the emission of the shell
radiating in the hydrogen line. The horizontal lines are the stellar
spectra caught by the slit, the brightest line is the spectrum of the nova.
The vertical lines are the lines of night sky emission. The strongest
vertical line is the emission Hα line. The ring is located
asymmetrically relative to the spectrum of the nova because the slit
has caught the light of a nearby star, which broadens the nova spectrum
downward
Fig.3.
The image of the stellar field including the Nova V1494 Aql. The color
image is the result of summing several frames taken in different filters
using the SAO RAS Zeiss-1000 telescope. The nova is indicated, a nearby
star located at the distance of 1.4 arcsec from it and partly caught
by the spectrograph slit is also visible
|